Seismology Lab
Jessie Contour worked at the American Museum of Natural History from 2016-2017 as a Helen Fellow, part of the BridgeUp:STEM program . Each Helen Fellow is placed into a different department in the museum to conduct research and create a fellowship project. Jessie was placed in the exhibitions department and worked on a redesign of the Discovery Room's Seismology Lab as her project. The goal of the project was to bring in modern seismologic technology, clarify educational lesseons, increase interaction touch points, and bring back excitement for this focal point in the room.
 The complete installation of the Seismology Lab consisted of three distinct sections.
- Global earthquake patterns - where and when do earthquakes happen?
- Earthquake waves - what are the types of waves and how can we use them to find where an earthquake has occured?
- Reading seismographs - how to you interpret all those squiggly lines?
Development Process
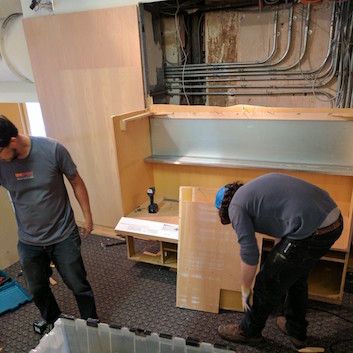
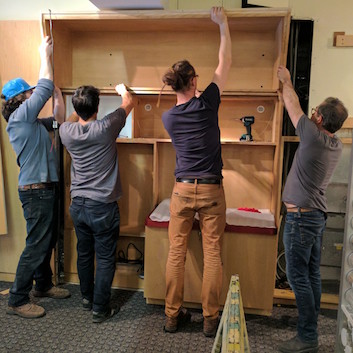
Research, conceptual development, graphic design, and technology implementation was done by Jessie. Fabrication design and physical construction was done by New Project , a full-service design, fabrication, and installation company, specializing in design and build solutions for museums, galleries, and corporate.
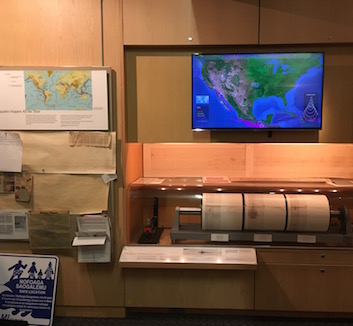
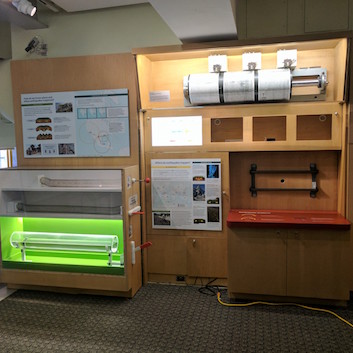
- Fig 1. Original Seismology Lab
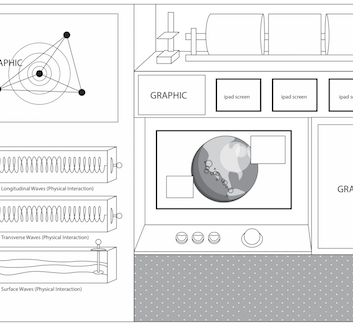
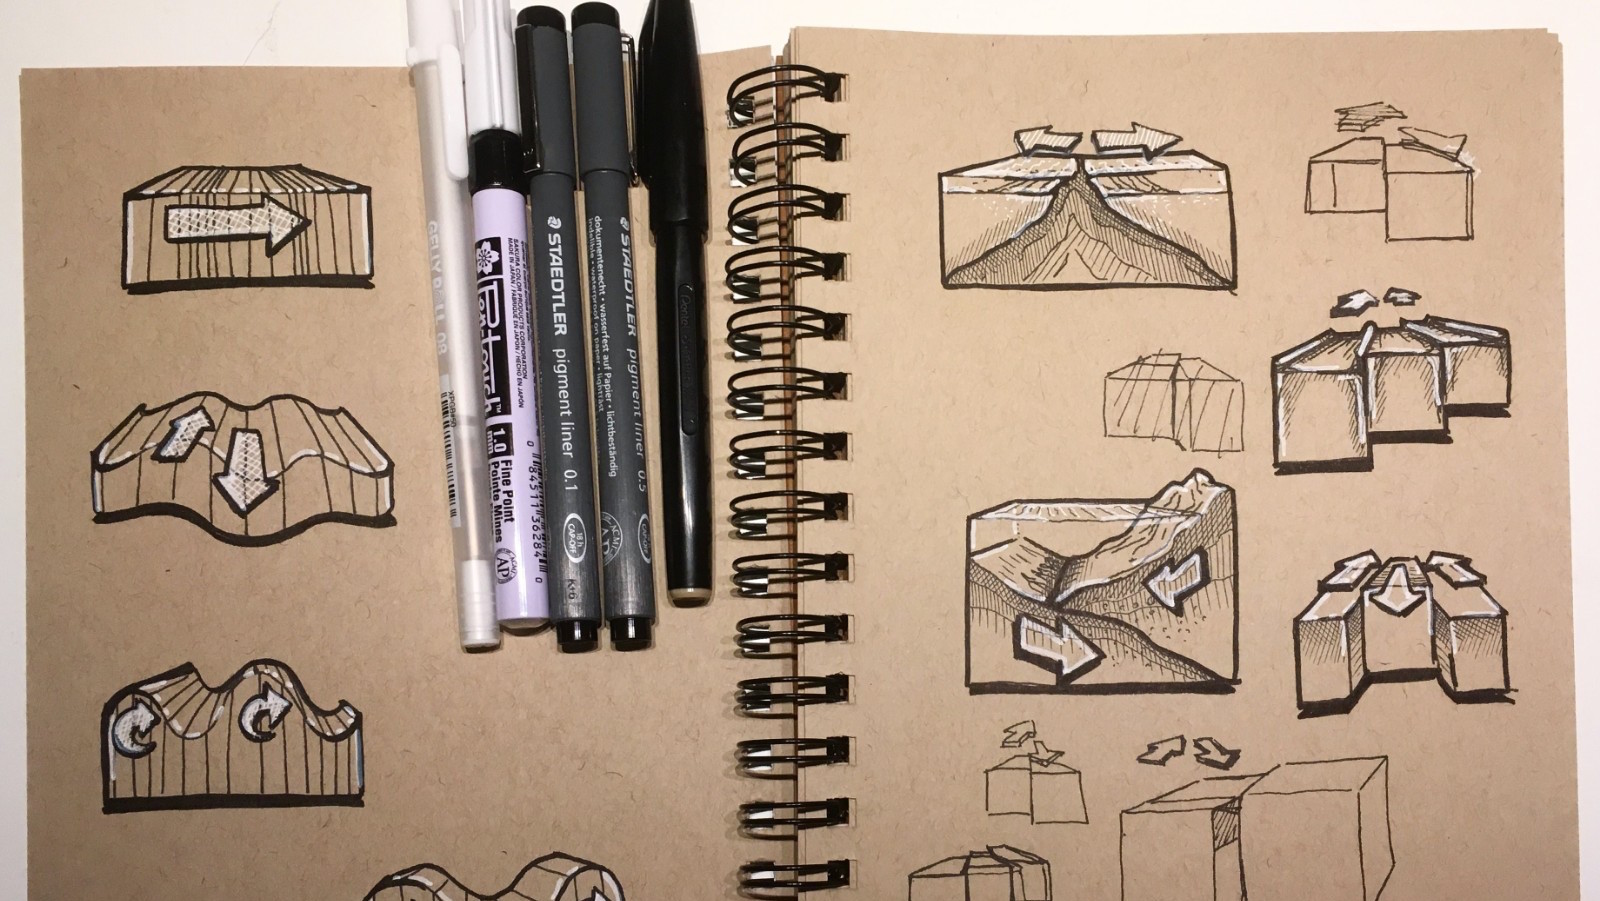
- Fig 2. Sketch of new exhibit concept done by Jessie Contour
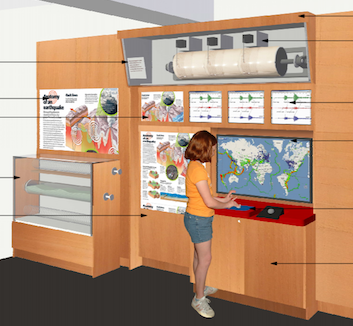
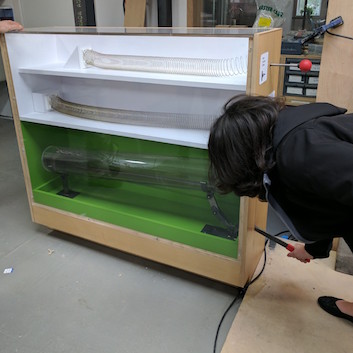
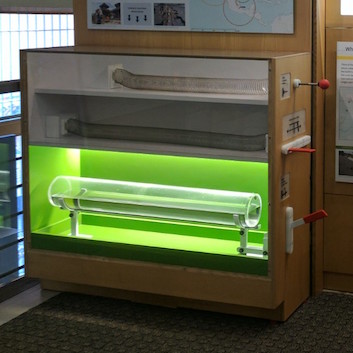
- Fig 3. Mockup of new design made in collaboration with New Project in Brooklyn
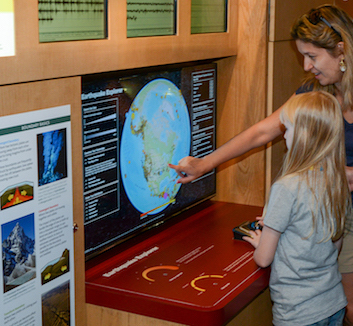
Global Earthquake Patterns
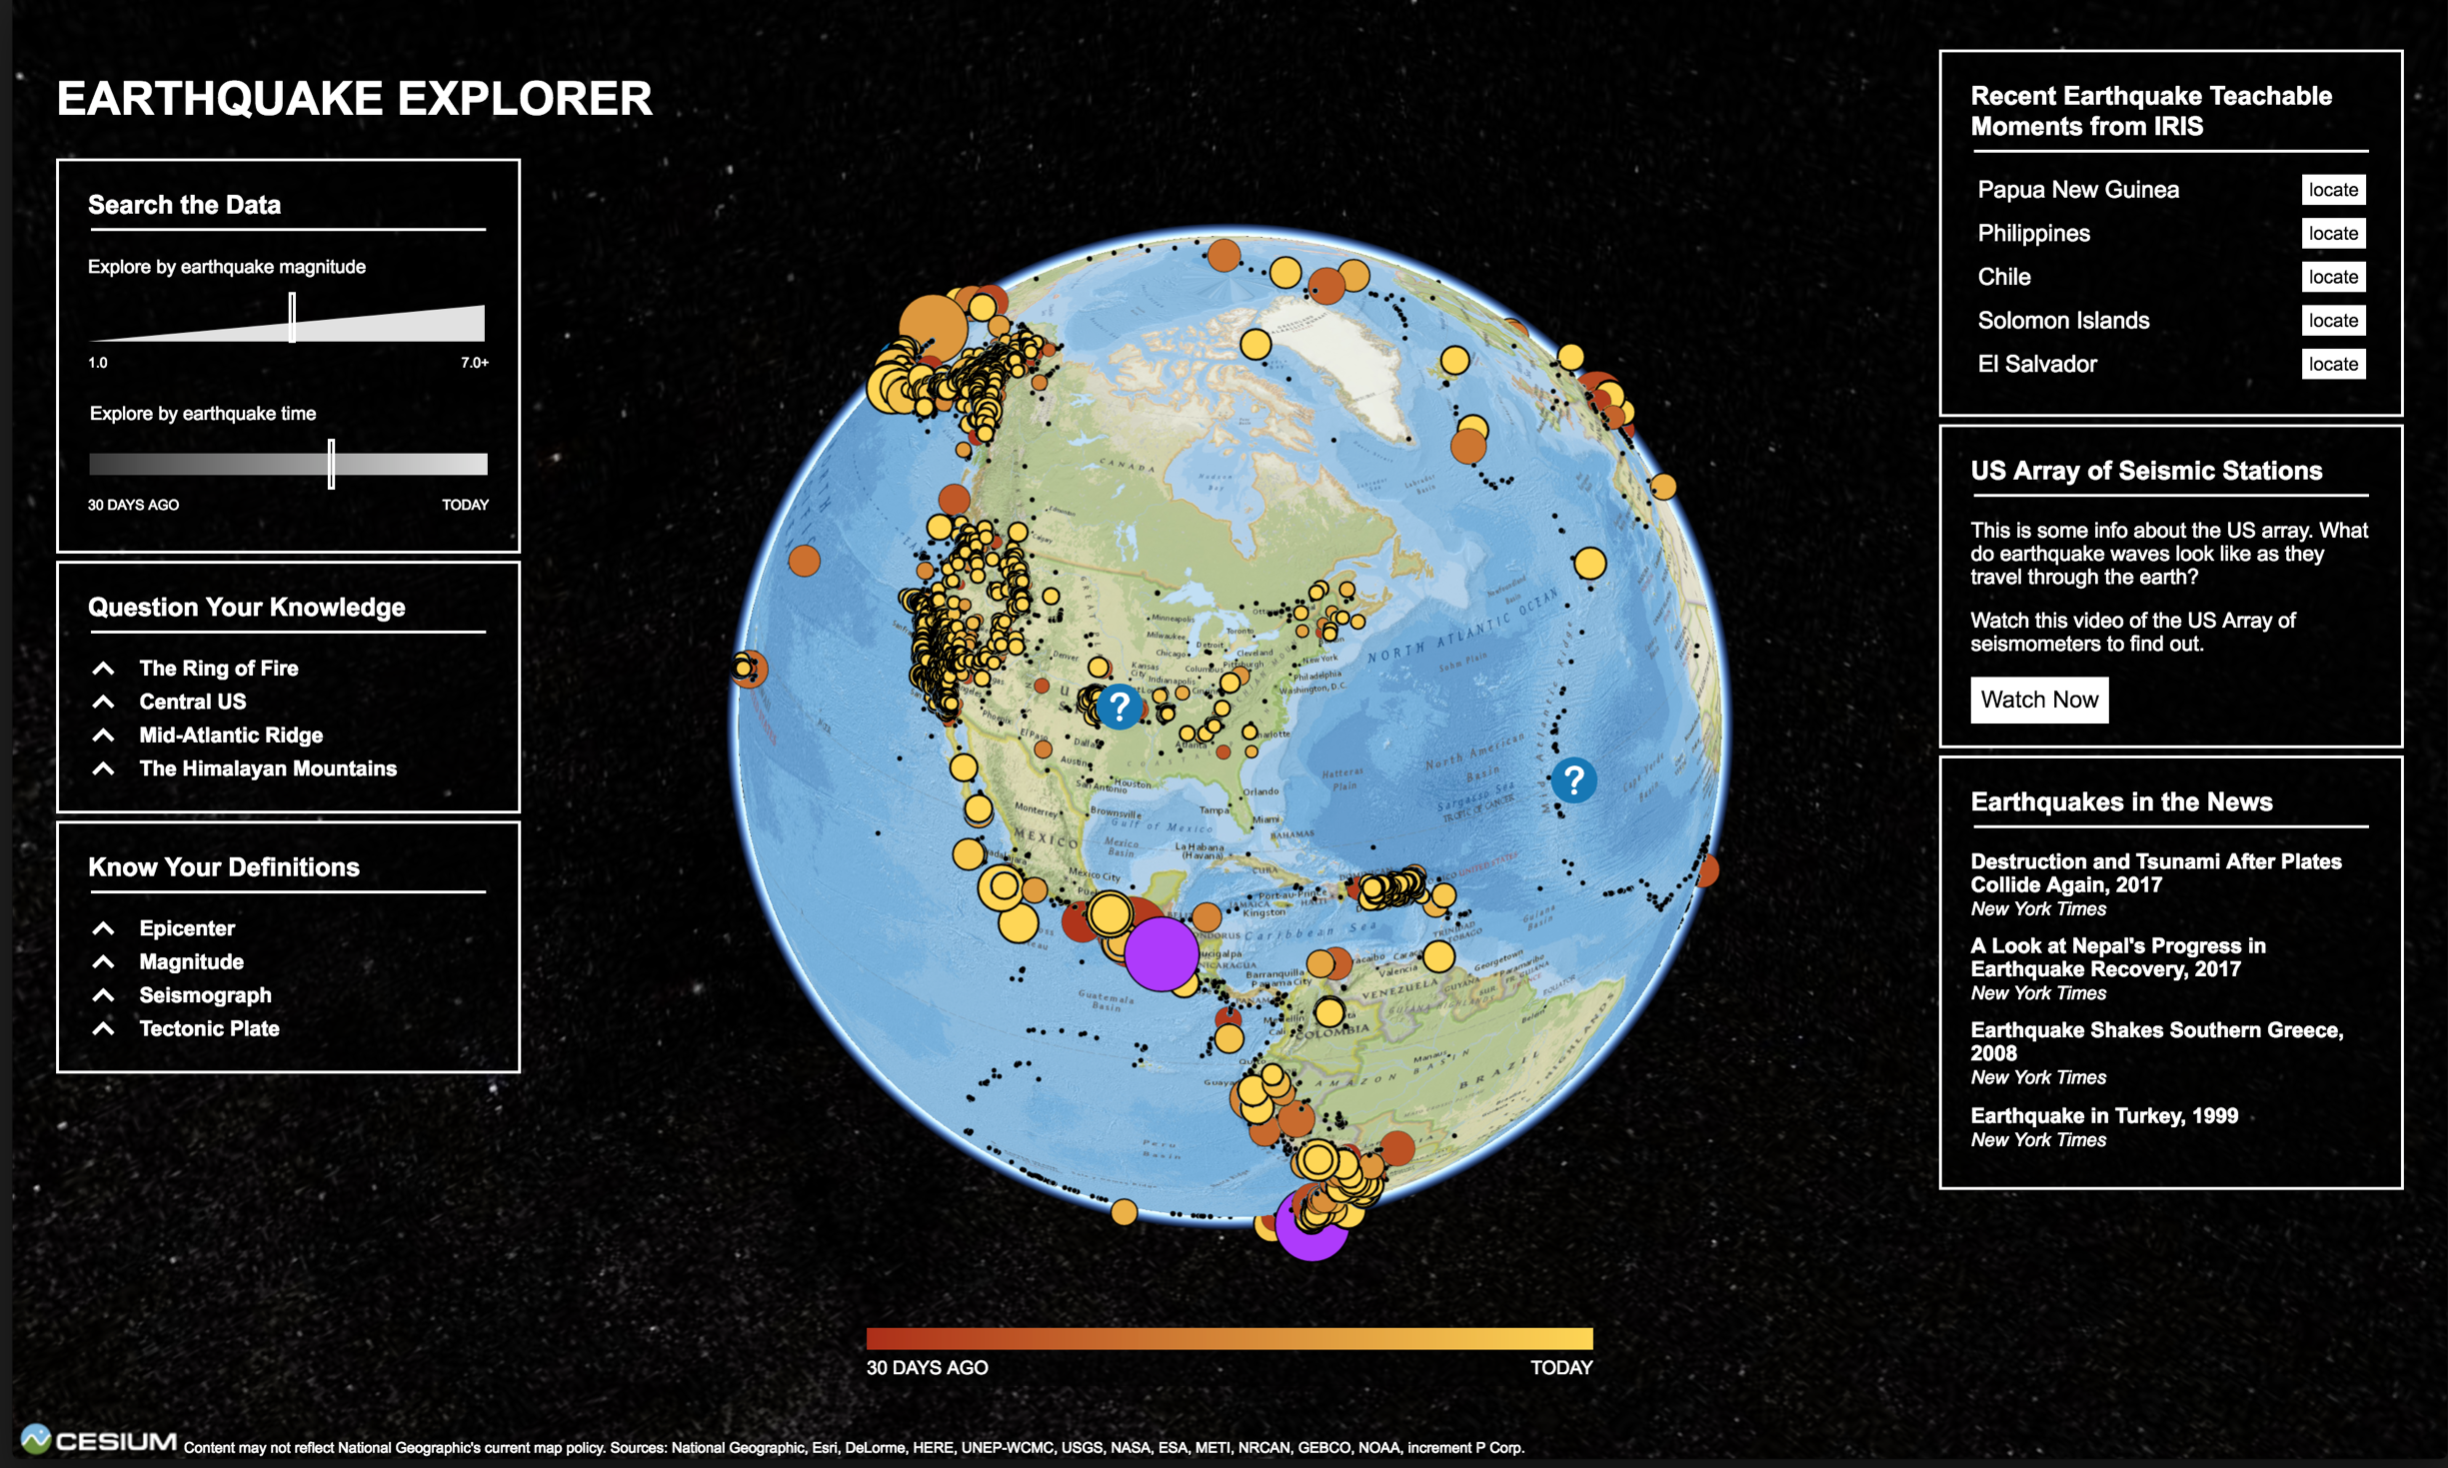
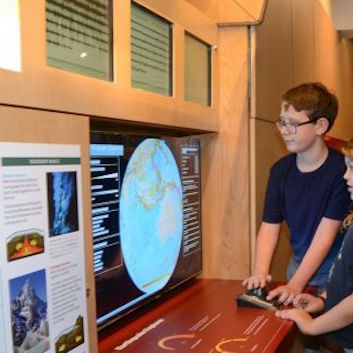
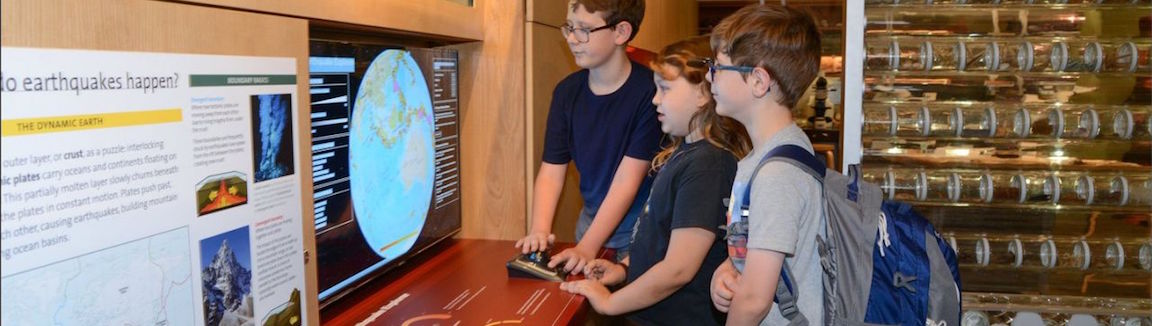
In order to communicate the patterns of earthquakes around the world, Jessie developed an interactive application called Earthquake Explorer. This application took live earthquake data from the USGS and mapped it onto a custom globe that could be explored using a physical mouse in the exhibit. The earthquake data could be filtered by time and magnitude in order to gain a greater understanding of the frequency and size or earthquakes that are happening.
In addition to this global map, there were features including highlighting points of interest such a the Ring of Fire, highlighting the most recent earthquakes that occured over magnitude 6.0, and showing informational videos on how the waves propagate across the surface of the globe.
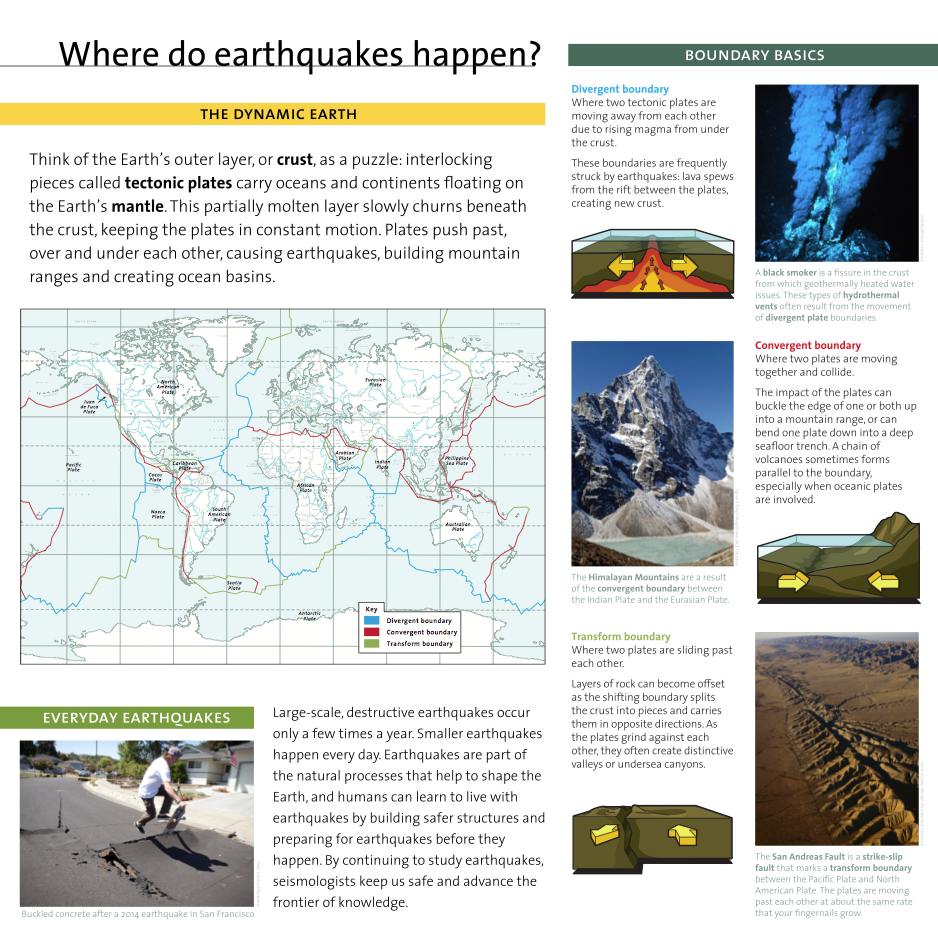
Next to this digital interaction was a graphic panel that educated on the concept of tectonic plates and how they relate to where earthquakes are occuring. This design and the illustrations were done by Jessie, content was written in collaboration with educators and scientists working in the field at the museum.
Earthquake Waves
In order to bring in more fun hands-on interaction for the children visiting the exhibit, the Earthquake Waves section was designed as a physical interactive. Slinkies and water tubes were installed with different types of movement handles in order to simulate waves passing through the earth. The two slinky interactions were derived from traditional lessons in middle school earth science curriculum, but the addition of a water tube to illustrate surface waves was an original concept by Jessie.
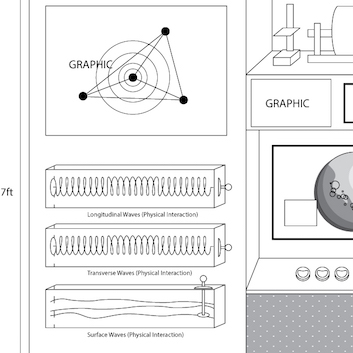
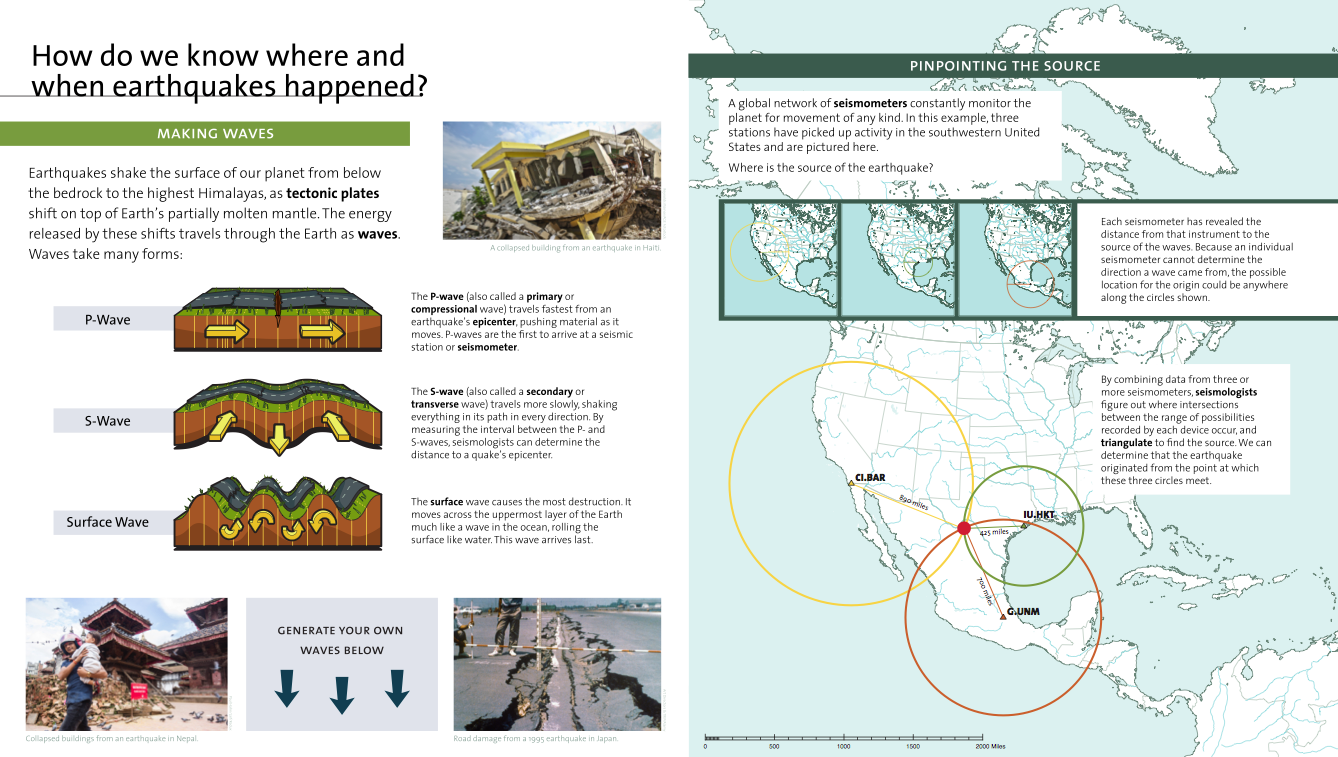
Above this physical interactive was a graphic panel that educated on the concept of earthquake wave types and how they are used to triangulate earthquake location. This design and the illustrations were done by Jessie, content was written in collaboration with educators and scientists working in the field at the museum.
Reading Seismographs
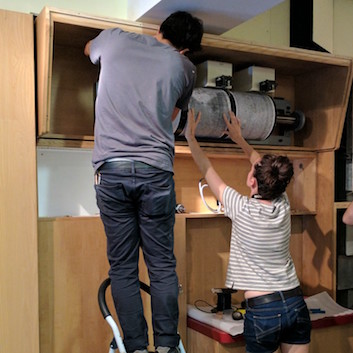
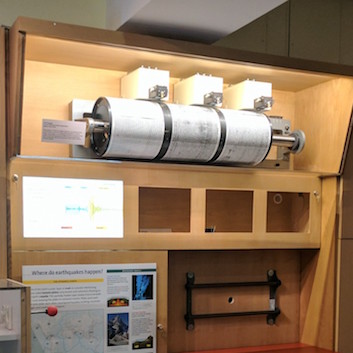
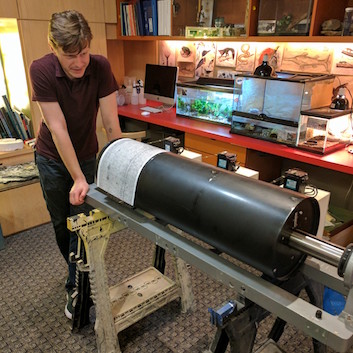
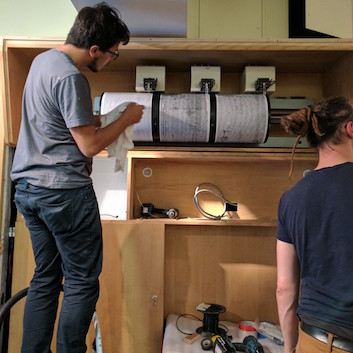
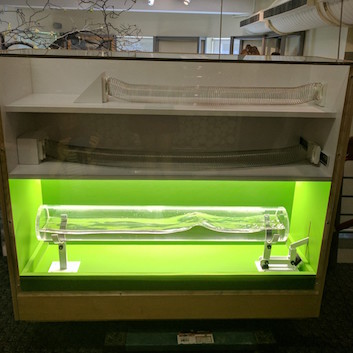
The seismograph from the original exhibit used to be one of the most exciting parts of the Seismology Lab. Visitors could see live data being drawn in real time onto the barrel. The seismograph had broken, but as part of the conceptualization of this new exhibit we decided to keep it as an artifact so that it could be displayed in comparison to the modern technology features on the screens below it.
Three raspberry pis run three screens showing the JamaSeis software, three different data streams from real seismograph stations are tracked in real time. Part of the work to get this running was to set up an automation system for the Raspberry Pis to boot and shutdown properly for ease of use for the Discovery Room staff. An additional graphic panel was created to explain how to decipher the seismograph readings.